Diagnosing Issues - Scenario #3
Set up Scenario #3
Run the below command in your Cloud9 Terminal.
cd ~/environment/tinyhats/3-sampleimage
for f in *.yaml; do envsubst < $f | kubectl apply -f -; done
It may take a second for everything to be ready again, so let’s monitor our pods’ status by running
kubectl get pods --watch
Once all the pods are ready, get your frontend-service url and let’s begin.
We shipped a new feature!
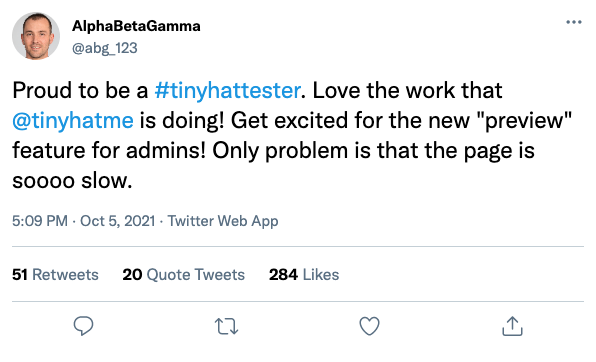 The engineering team at Tinyhat.me has shipped a new feature to allow admins to preview their hats before it gets approved. However, initial admin beta testers have revealed some frustrations with the service, as page load speeds are reaching unbearable lengths.
Replicating the Issue
Try navigating to {FRONTEND URL}/admin?password=ilovecats, which is the approval interface for admins.
The time it takes to load the preview of the hats takes longer than the previous version. A blank black screen appears before finally displaying the hats.
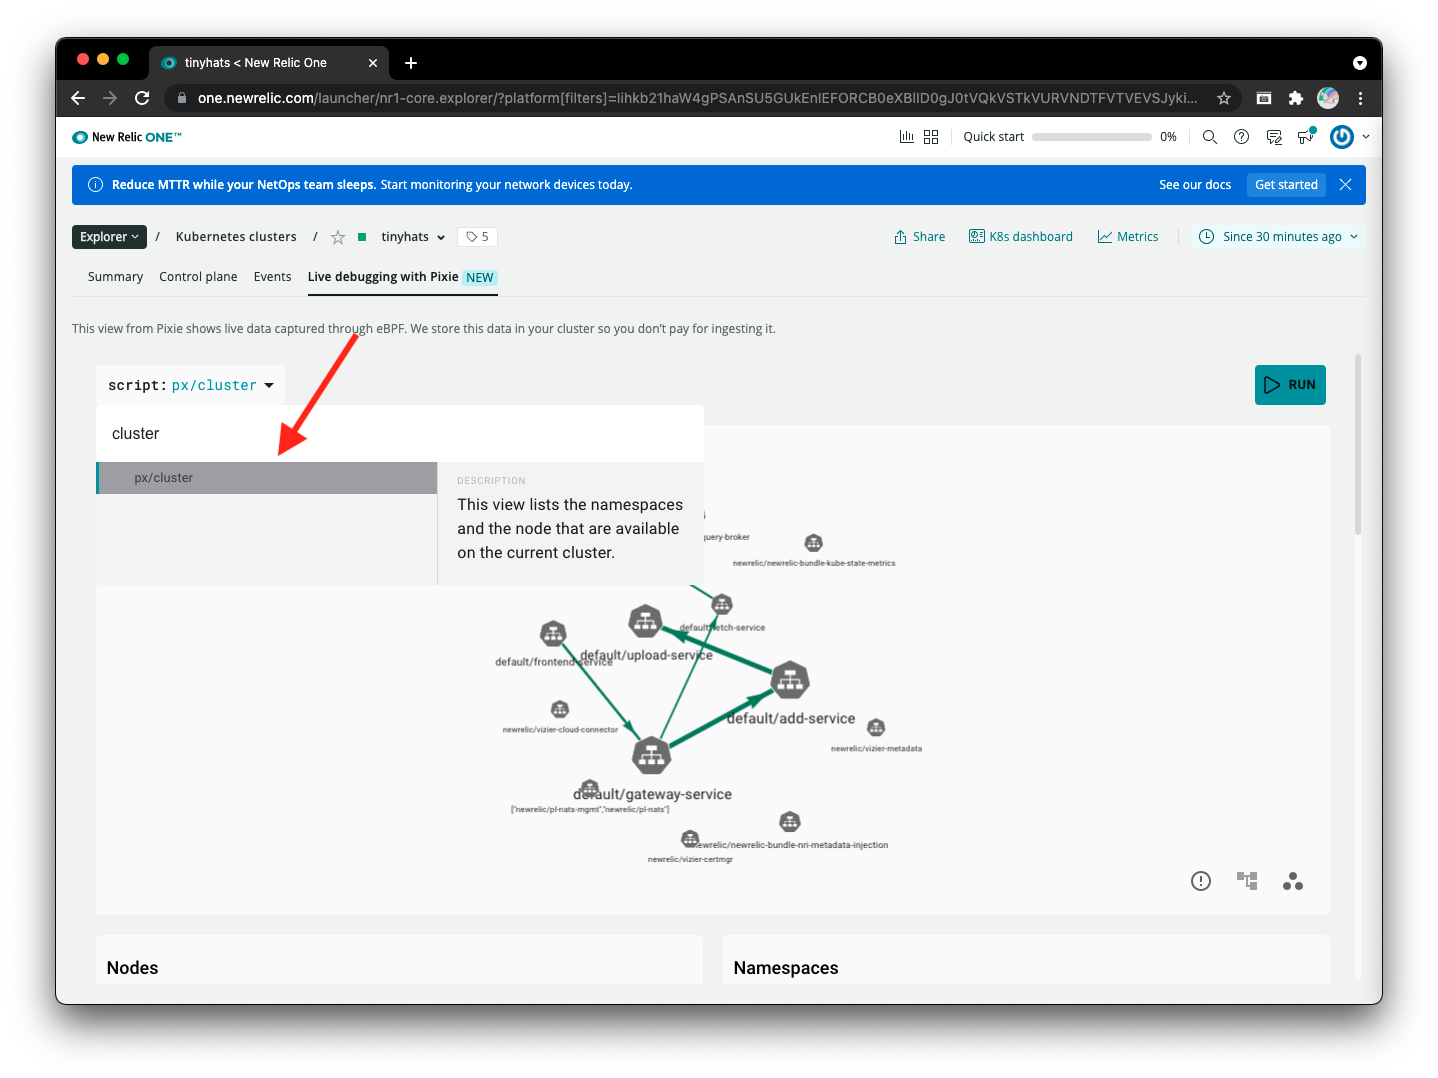
Then, open Pixie to see what’s going on! Just like before, run the px/cluster script to gain an overview of what is happening in the cluster.
Scroll down to the Services section and notice the latency for each different service.
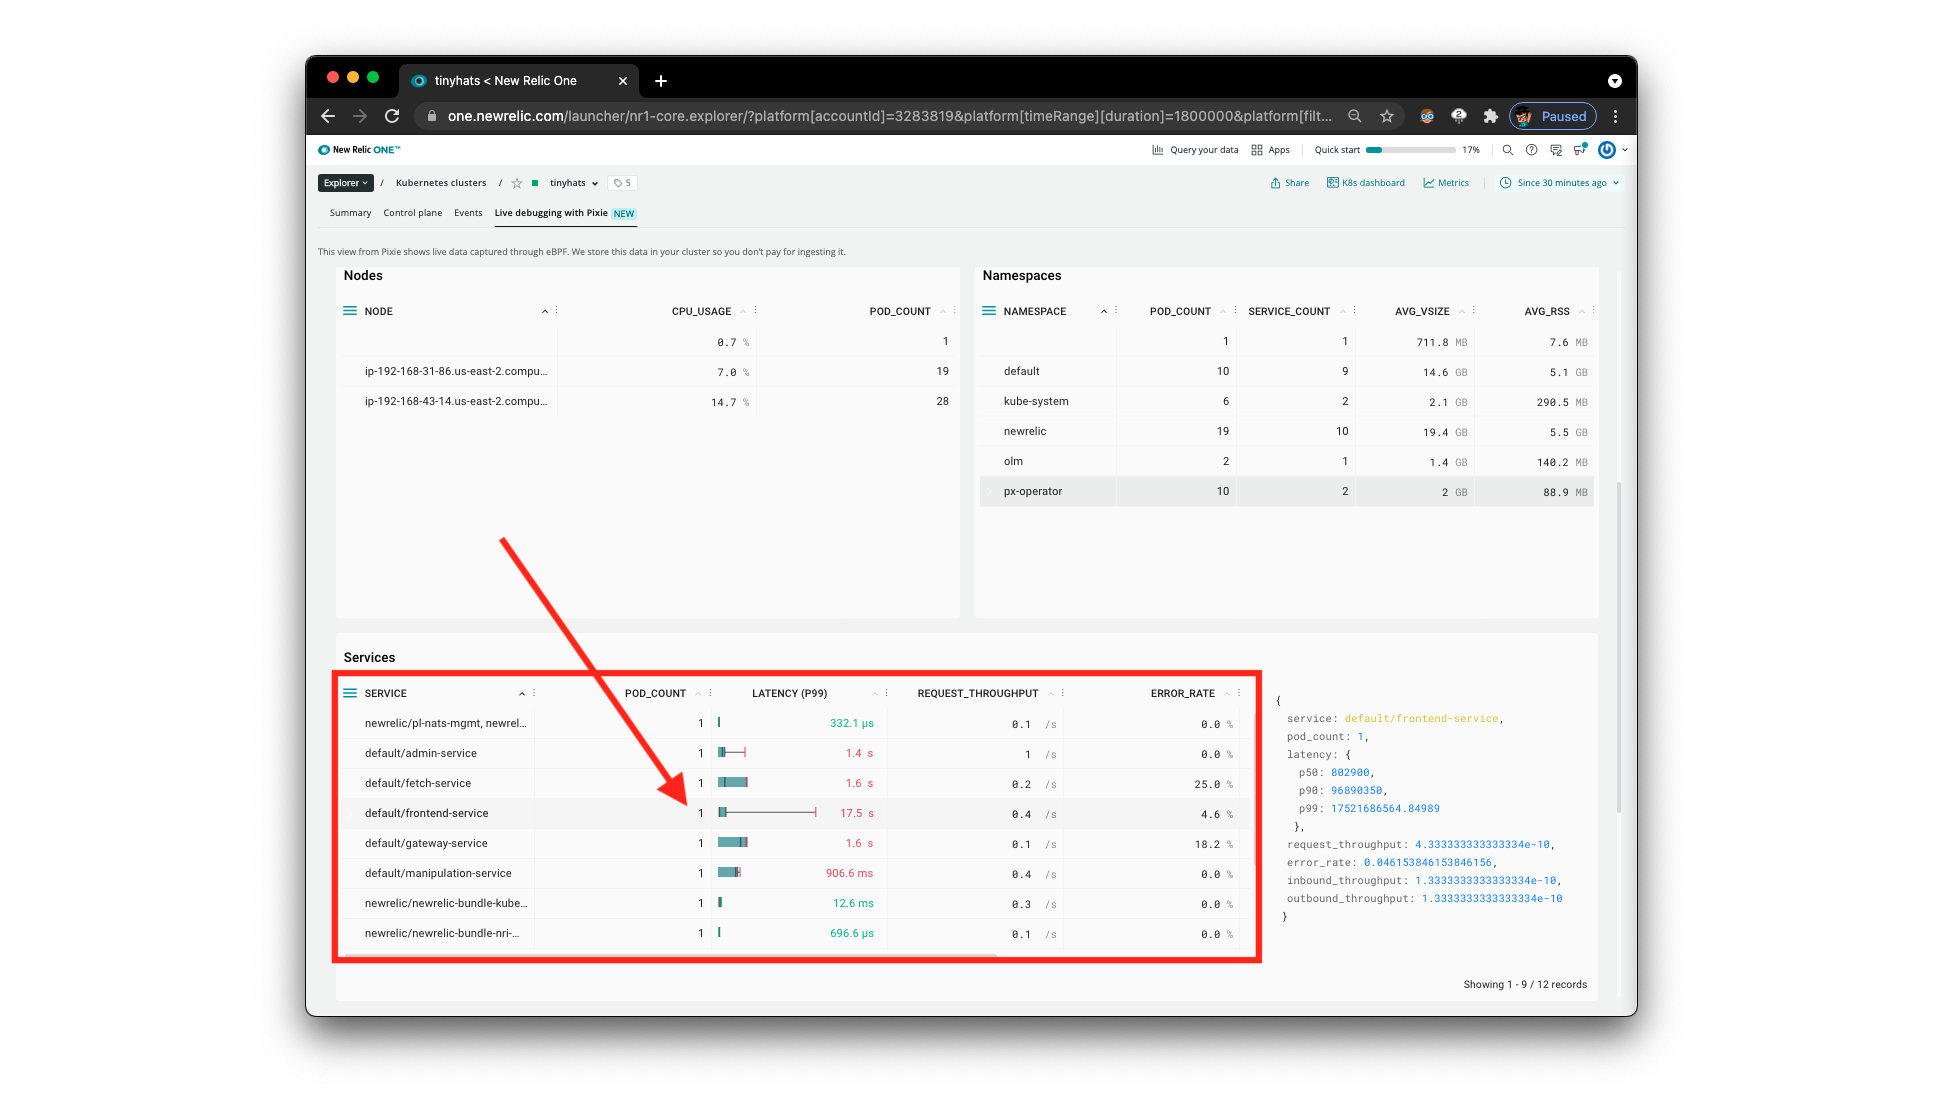
The engineers were on the right path: it looks like indeed the frontend service is getting a lot of latency. Let’s figure out what’s going on.
Using px/service to do root-cause analysis
This time, we’ll be using the px/service script, so select it from the dropdown. As we’ve identified in the previous step, the frontend-service is definitely of concern. Give the script the default/frontend-service parameter by typing it in the service dropdown.
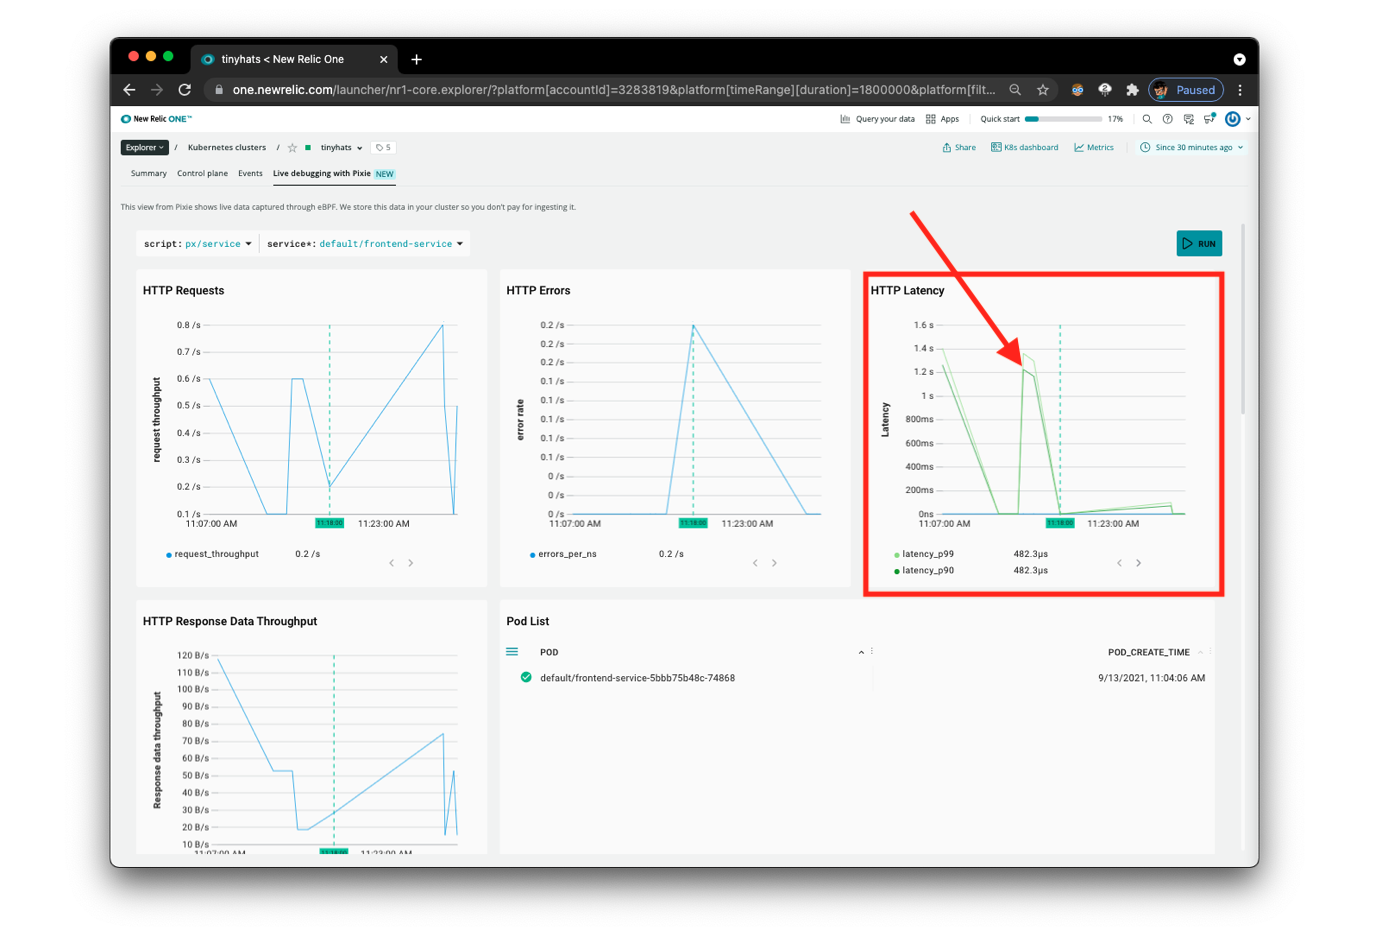 Although the above page,
 px/service gives us a visualization of the HTTP Latency we observed with px/cluster, it still doesn’t provide us with enough information to determine what is actually causing the high latency.
There is more information, however, below this section. Scroll down to Sample Of Slow Requests. This will provide us with exactly what we need: “slow requests.” Using this feature from Pixie, we’ll be able to identify where the long page load is triggered from.
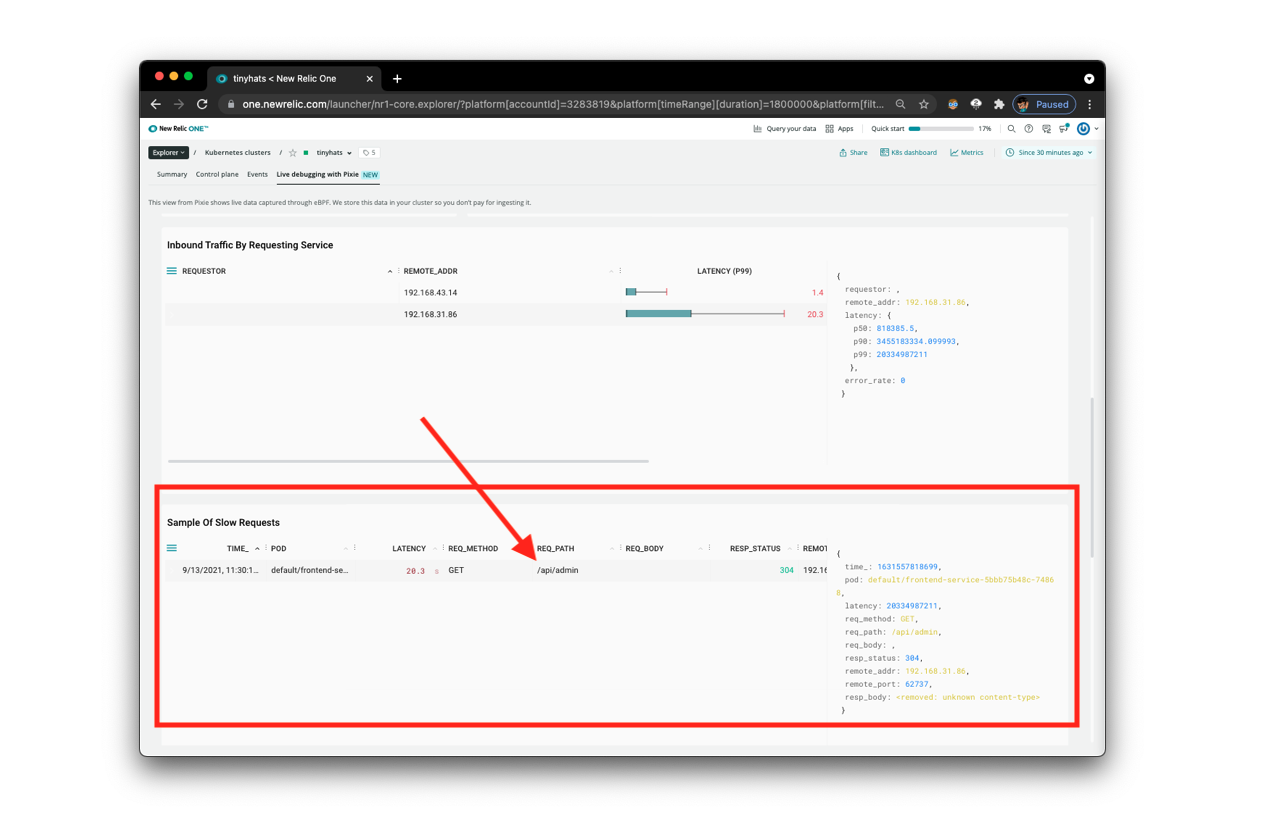
Looking at the REQ_PATH, we can now identify that the slow request is to the /api/admin endpoint. We can then conclude that the admin-service is the source of the long loading times.
What’s happening? When
frontend-servicemakes a request for admin actions on TinyHat.Me, it is taking a long time foradmin-serviceto respond.
Using px/flamegraph to find the potential fix
Flamegraphs in Pixie
We are going to use Pixie’s Always-On Profiling feature to investigate this slowdown, using a flamegraph to identify a performance issue within the application code.
originally from Pixie Documentation
Every ~10ms, the Pixie profiler samples the current stack trace on each CPU. The stack trace includes the function that was executing at the time of the sample, along with the ancestor functions that were called to get to this point in the code.
The collected samples are aggregated across a larger 30 second window that includes thousands of stack traces. These stack traces are then grouped by their common ancestors. At any level, the wider the stack, the more often that function appeared in the stack traces. Wider stack traces are typically of more interest as it indicates a significant amount of the application time being spent in that function.
The background color of each box in the flamegraph adds an extra dimension of data:
- Dark blue bars indicate K8s metadata info (node, namespace, pod, container).
- Light blue bars represent user space application code.
- Green bars represent kernel code.
Running px/perf_flamegraph
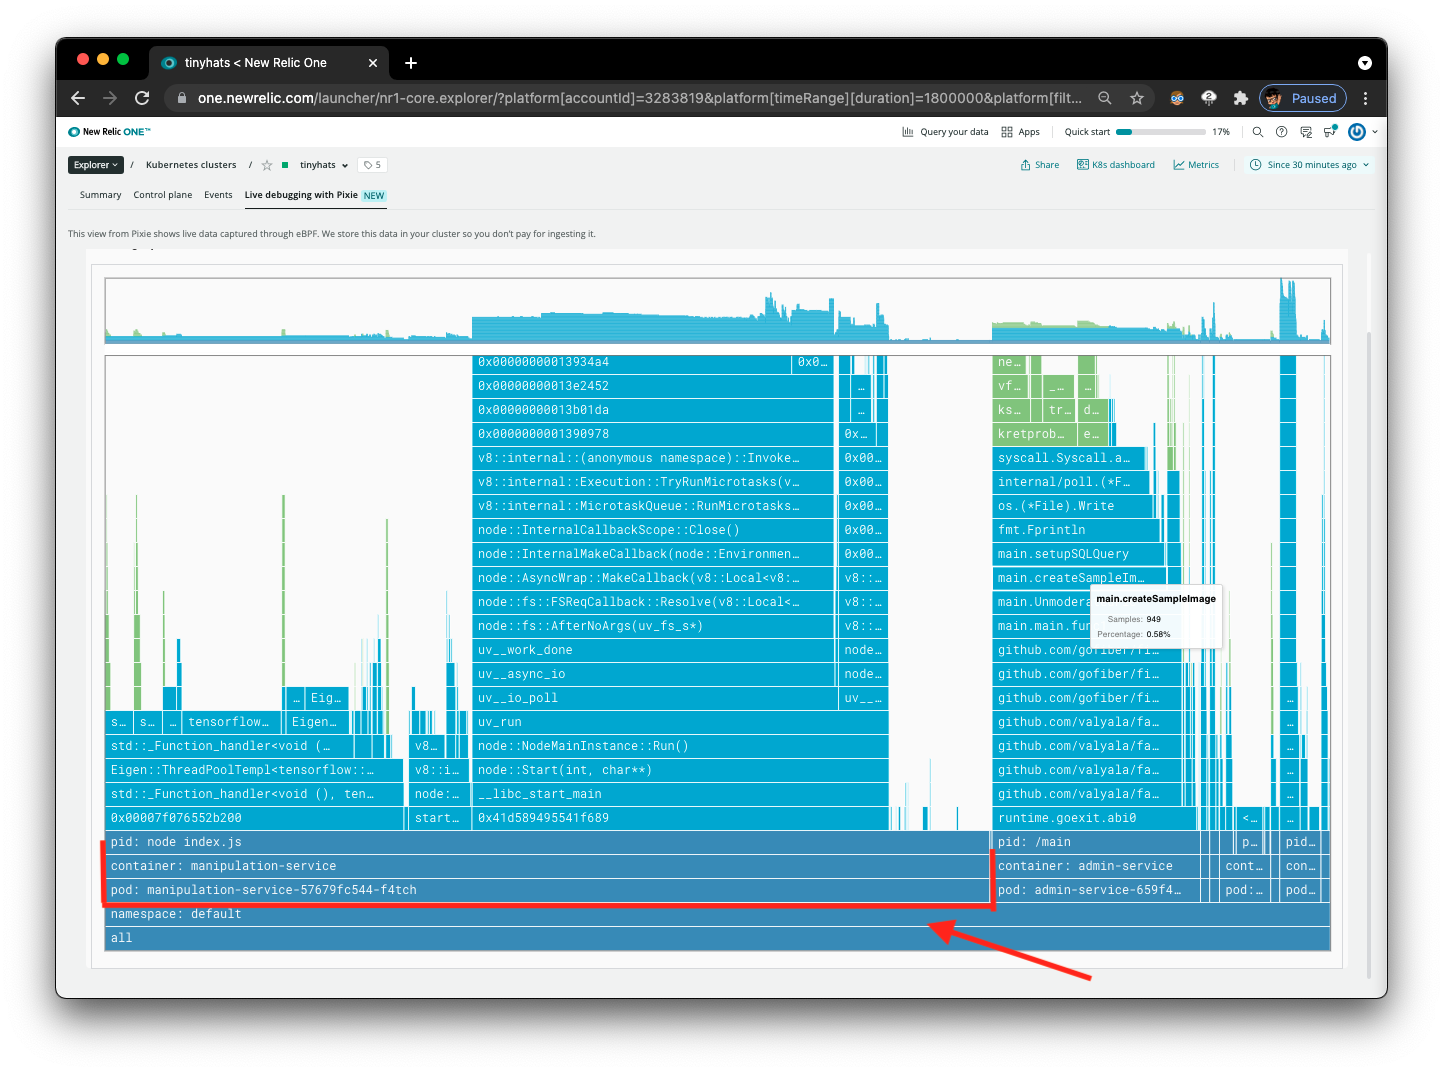
Using the dropdown, search for and select the px/perf_flamegraph script. However, this flamegraph has too much information, we want to narrow this down to the namespace that we care about: default. This contains all of the services specifically pertaining to the deployment of TinyHat.Me, and excludes other services that monitor the Kubernetes cluster’s health.
Click on the namespace parameter and type in default to filter the flamegraph by the namespace we want to focus on.

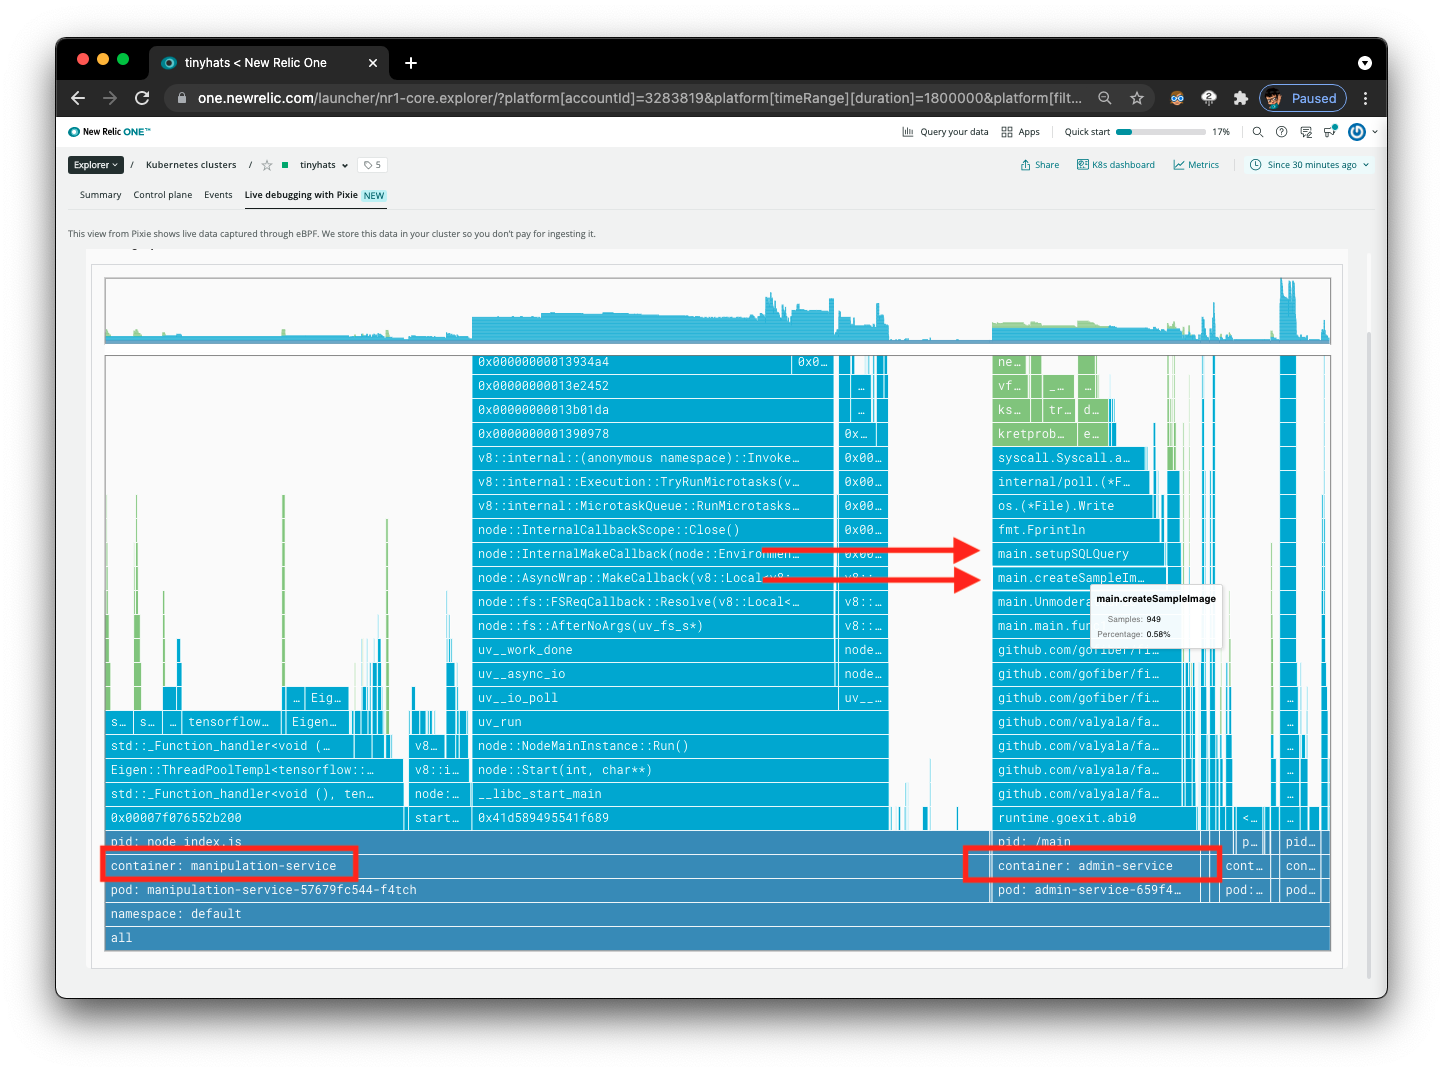
Now that the interface is cleaner, notice the two containers that are running in the flamegraph, manipulation-service and admin-service.
Focus on admin-service, the service we are analyzing in this situation.
Using Flamegraphs to Draw Conclusions
Here’s what we can identify now:
- The function
main.createSampleImagesis being called repeatedly. - The function
main.createSampleImagesis calling themanipulation-serviceeach time as well. This can be inferred by the large width of the columns for this service on the flamegraph.
Identifying the Problem and Creating a Solution
Based on the calls for /manipulate and /admin, we individually generate the sample image every time the /admin route is being called. Instead of making so many HTTP requests every time the admin dashboard is being accessed, we should save the mockup when the user uploads the image to improve page load speeds.