New Relic Pixie Workshop > New Relic One and Pixie > Using Pixie with New Relic One > Run a PxL script
Run a PxL script
Let’s use New Relic One’s Live Debugging with Pixie to run a built-in PxL script.
Run a PxL Script
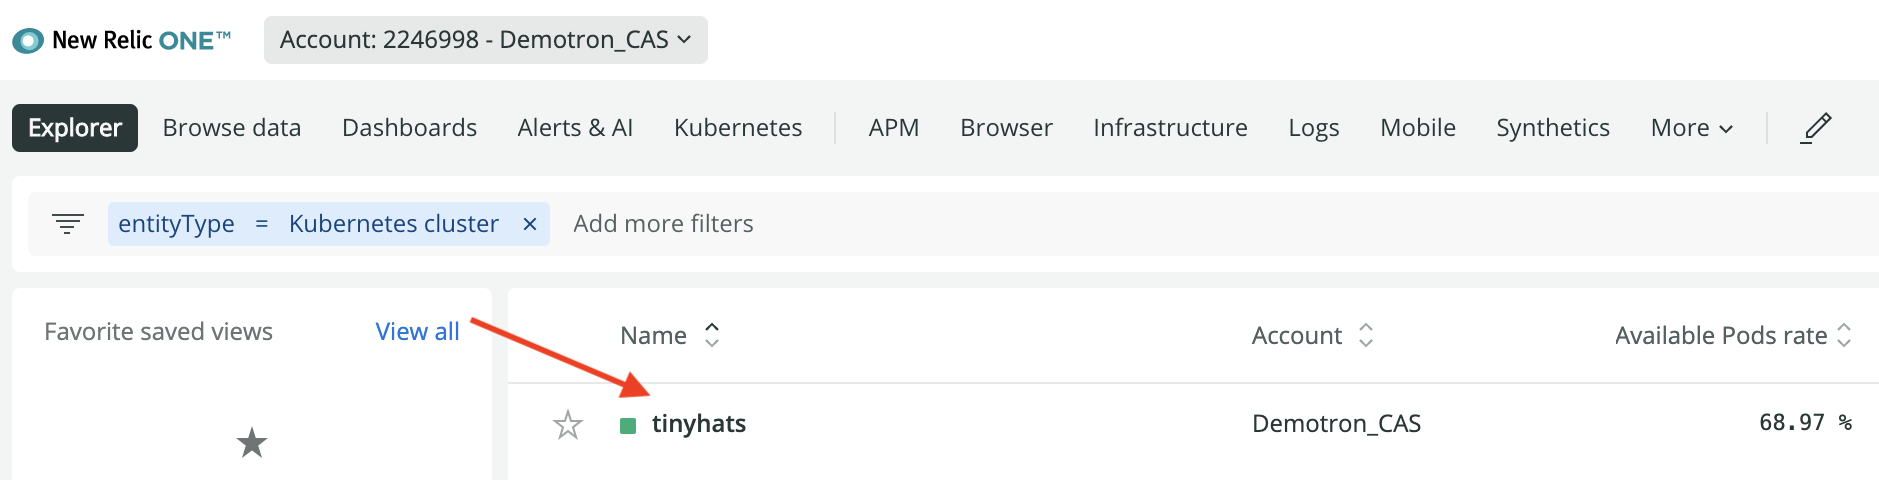
- Open your New Relic One homepage
- Click on the Kubernetes link

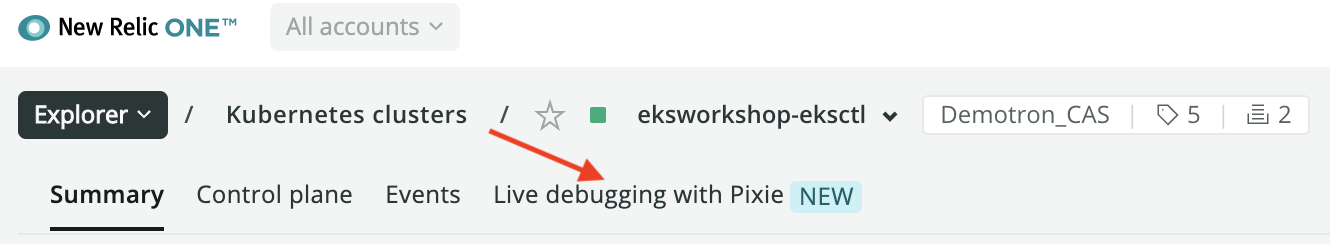
- Click on the name of your cluster
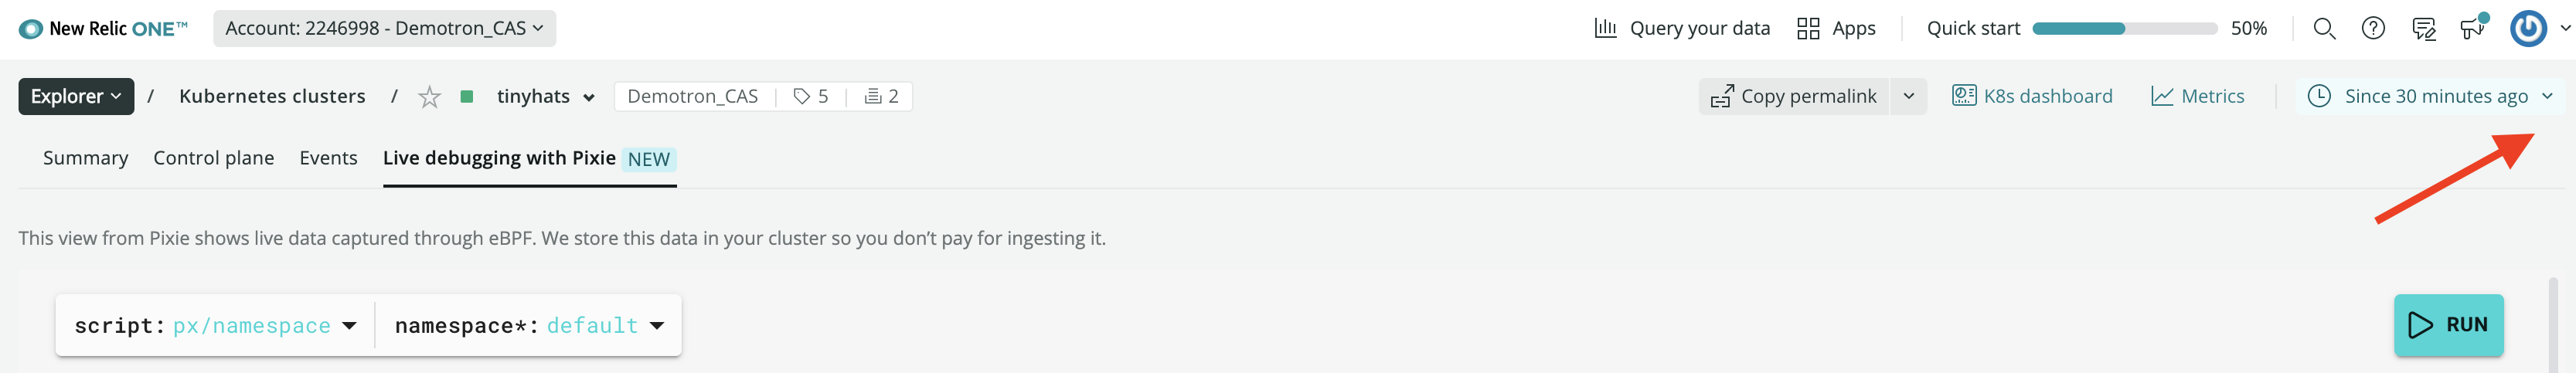
- Click on Live debugging with Pixie
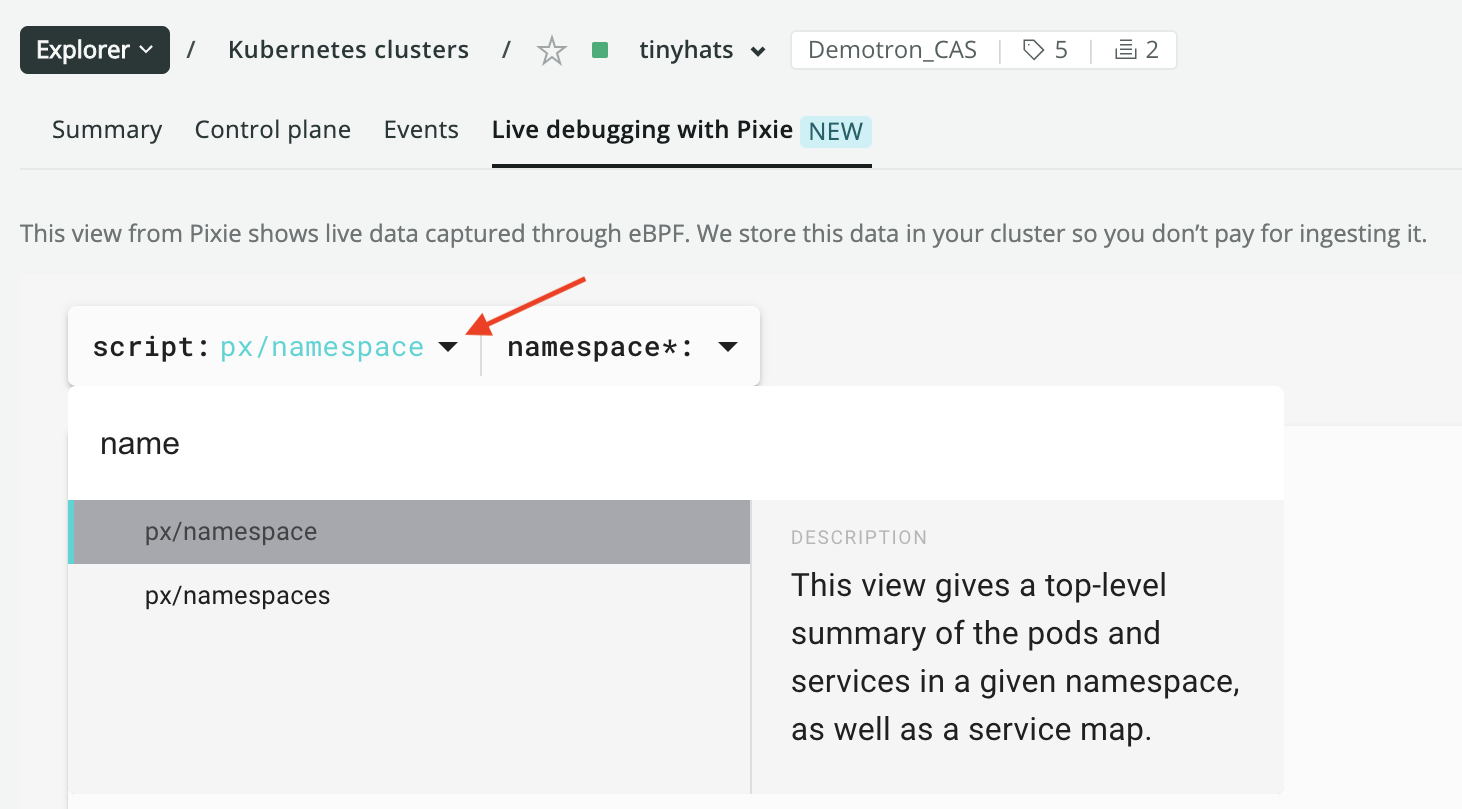
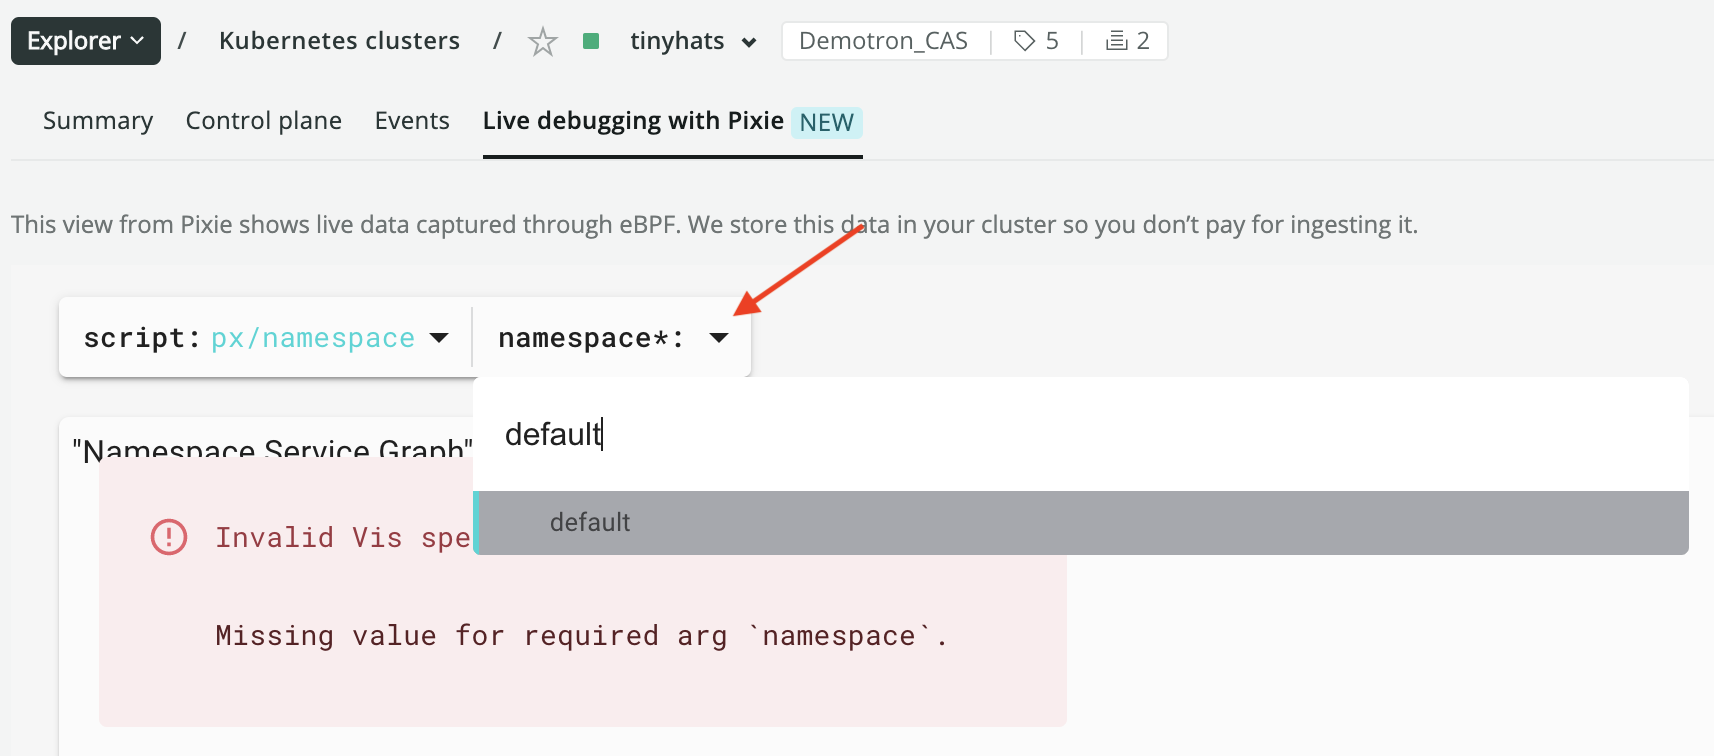
- Select the
px/namespacescript from thescriptdrop-down menu.
- This script has one required argument (as denoted with an
*). Enterdefaultfor thenamespaceargument.
After the script executes, you should see a view similar to the following:
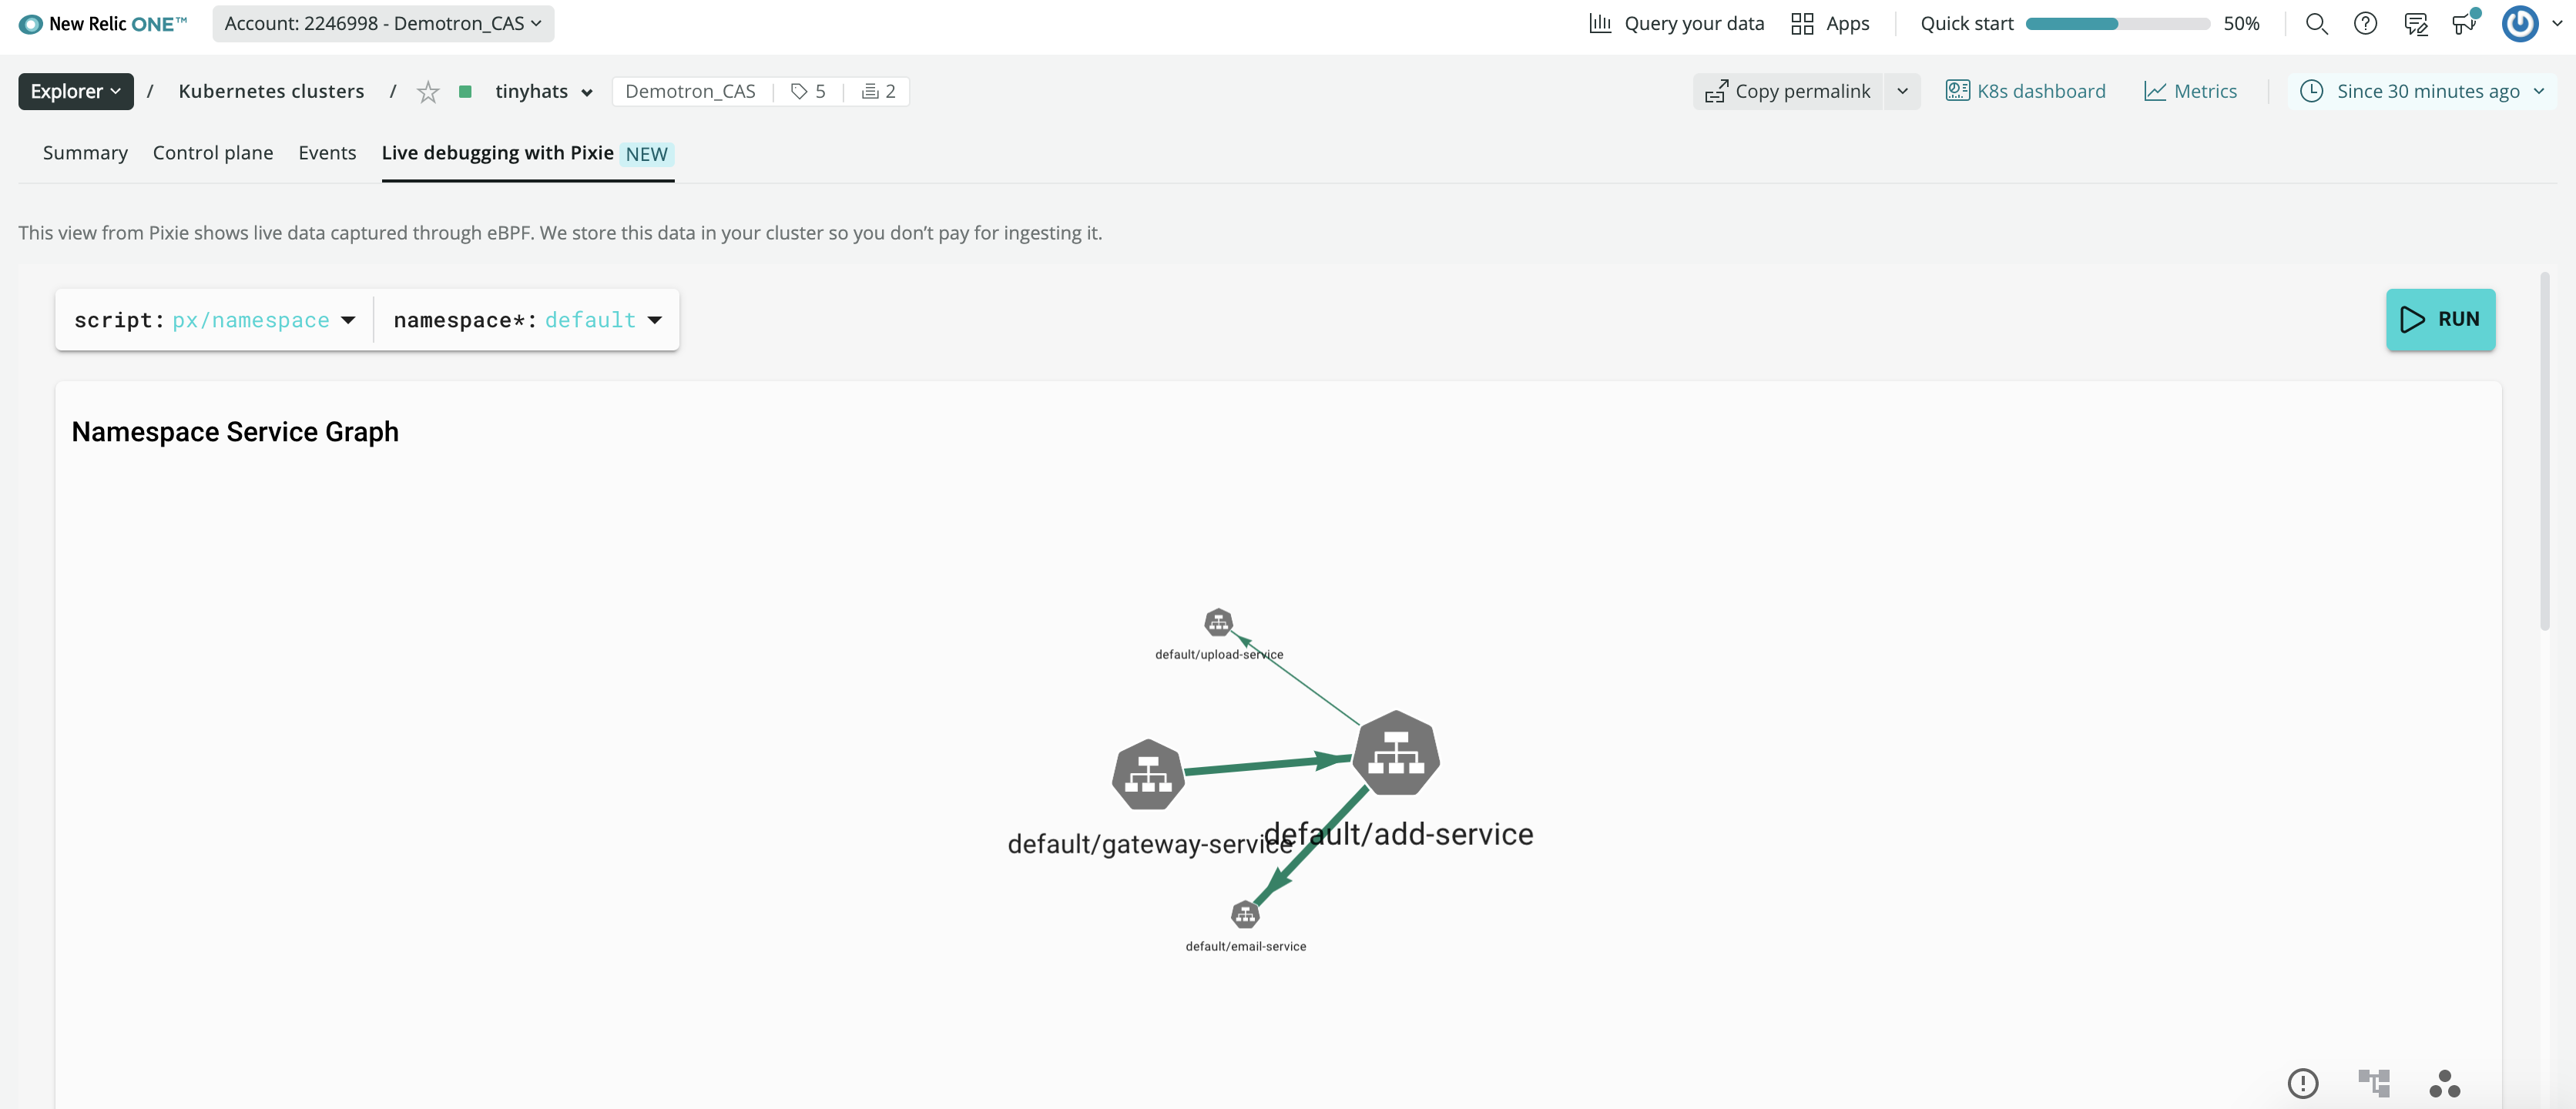
This script (px/namespace) shows:
- A service graph of HTTP1/2 traffic between the pods in the specified namespace.
- A list of the services and pods with high-level resource and application metrics.
This script takes one other argument, start_time. This argument is specified using the Time Picker dropdown at the top right hand side of your screen and provides the time window for the query.